Abstract: Primary archaeological data drawn from the interfluvial region between the Calcasieu and Red Rivers in South Central Louisiana are summarized and compared to radiocarbon proxy measures of regional demographics in the greater southeast. Although the long-term growth rate for the region is calculated at 0.06–0.07% based on the diagnostic projectile point and radiocarbon date data, it is estimated that a complete review of the regional radiocarbon record would indicate a more modest growth rate in the 0.03–0.05% range. Variation in the spatial density of radiocarbon dates suggests aboriginal population densities within linear riparian zones were roughly 5 to 6 times those maintained in the flanking uplands. The upland interfluvial zones where most of the Kisatchie National Forest ranger districts are located would certainly fall into the lowest density category. The broad picture of archaeological site and isolated find density developed from systematic fieldwork on Kisatchie National Forest parcels is highly concordant with the larger regional spatial and temporal patterns.
Review of the prehistoric cultural-historic sequence of highlights the close relationship of the central Louisiana archaeological record to the developing picture of Late Pleistocene through Holocene aboriginal occupation in the broader southeastern and mid-continental U.S (Childress and Saatkamp 2021). The early antiquarian and pre-radiocarbon era professional investigations have been significantly augmented during the past four decades by compliance related archaeology conducted within the boundaries of the various Kisatchie National Forest (KNF) ranger districts and regional military installations. The modern cultural resources management work has been particularly robust from a research standpoint because the examined landscapes have approached what might be considered a truly random sample, rather than a biased series of tracts containing high-profile sites that might be expected to yield the maximum amount of desirable, museum-quality artifacts. This is a distinct scientific advantage, but it is accompanied by a daunting challenge for anyone wishing to synthesize and summarize a small mountain of systematic data that is dispersed across a multitude of agencies, institutions, and private sector concerns. One of the most comprehensive synthetic treatments of the interfluvial region between the Red and Calcasieu drainages is based on the work done at Ft. Polk (Vernon and Sabine parishes; Anderson and Smith 2003). A comparable summary for findings in the various KNF districts would be a significant augmentation to regional research. Information on long-term trends revealed by the various Ft. Polk investigations is summarized in Table 1 and Figures 1 and 2.
Table 1. Diagnostic projectile points and suggested temporal spans, Ft. Polk, Louisiana.
| Period | Span | BP midpoint | Years | PP/K Count | PP/Ks/year | STD | STD % |
| Late Prehistoric | 1000-200 BP | 600 | 800 | 667 | 0.834 | 114.64 | 0.538 |
| Woodland | 3200-1000 BP | 2100 | 2200 | 829 | 0.377 | 51.81 | 0.243 |
| Late Archaic | 5700-3200 BP | 4450 | 2500 | 464 | 0.186 | 25.52 | 0.12 |
| Middle Archaic | 8900-5700 BP | 7300 | 3200 | 148 | 0.046 | 6.36 | 0.03 |
| Early Archaic | 11,450-8900 BP | 10175 | 2550 | 77 | 0.03 | 4.15 | 0.019 |
| Late Paleoindian | 12,900-11,450 BP | 12175 | 1450 | 101 | 0.07 | 9.58 | 0.045 |
| Early Paleoindian | 13,450-12,900 BP | 13175 | 550 | 4 | 0.007 | 1 | 0.005 |
| TOTALS | 2290 | 213.06 |
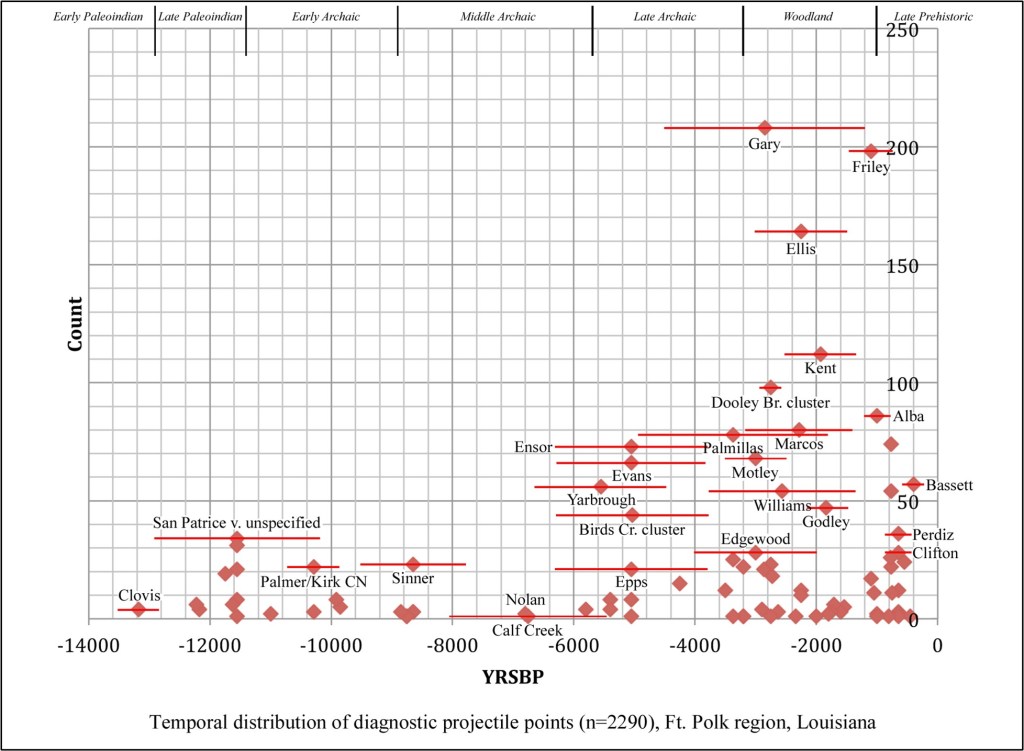
In considering the disaggregated data on the frequency, temporal slotting, and approximate use-spans of various diagnostic projectile points (Figure 1), several suggestive patterns are immediately apparent. The most obvious is the long-term exponential growth trend in the overall frequencies, with a dramatic increase beginning in the post-Hypsithermal Late Archaic. It is particularly noteworthy that the Ft. Polk data show this trend continuing to the terminal portion of the late prehistoric interval, in line with expectations that would be derived from a consideration of demographic patterns based on a relatively stable but modest pre-industrial growth rate (ca. 0.03–0.05%; Bettinger 2016). This consistency appears to be directly related to the fact that the diagnostic weapon tips are derived almost exclusively from systematic shovel and test unit excavations rather than surface collections from agricultural fields (the latter sample types, quite common in alluvial settings, are particularly biased against the recovery of small, late period arrow points, and the spurious indication of “decline” generated by consideration of biased surface collections has more than occasionally been employed as evidence for late prehistoric population growth rate/density reductions or “migrations”). During the earlier pre-ceramic intervals, the significant representation of San Patrice variants and what appears to be a muted Middle Archaic presence in the region are also reflected in the distribution.
These primary data on the temporal distribution of stone tool diagnostics are collapsed and aggregated in Table 1 and Figure 2 (see also Anderson and Smith 2003:Figure 5.14). In addition to the rather typical adjustment for the duration of the period in question (PP/Ks per unit time), these ratios are further standardized by dividing each grouping by the smallest value (Early Paleoindian at 0.007). Calculating the proportion of the total of the standardized values (in this case 213.06) facilitates the comparison of this sample with others containing different numbers of diagnostics. The resulting plot allows for a coarse measure of demographic variability in the region of interest and points to some long-term trends that have also been elucidated in adjacent areas (and sheds considerable affirmative light on the question posed in the Ft. Polk summary: “can measures of local population density be developed . . . perhaps using numbers of diagnostic artifacts as a proxy measure for people” [Anderson and Smith 2003:363]?).
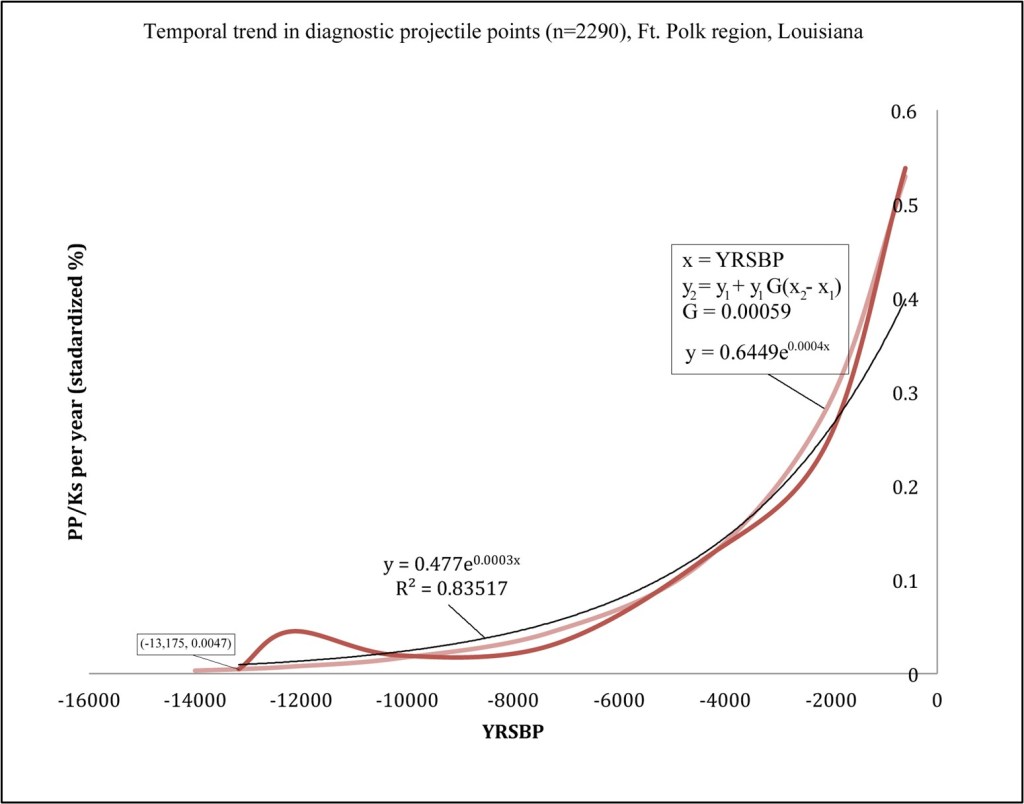
Employing the divisions of the Fort Polk sequence suggests a clear exponential trend in regional demographics between the earliest occupation period and the onset of European exploration and settlement (Figure 2). Although the fitted line generated by the statistical component of the spreadsheet application (black) has a very high correlation coefficient, the algebraic growth function (pink) appears to visually accommodate the raw data trend in a slightly more convincing manner, particularly considering the nearly perfect overlap in the initial and terminal dependent variable values. These proxy data indicate a gradually increasing regional population with a growth rate of 0.00059 (0.059%). They also strongly suggest, along with other independent lines of evidence from the greater southeast, that the deviations indicated for the Late Paleoindian/Early Archaic (San Patrice) and Middle Archaic intervals should not be taken at face value to indicate either periods of “rapid growth” or “population decline.” This is certainly a possible explanation, but a stronger argument could probably be made that these are measures of variation in the relative intensity of local settlement and land use.
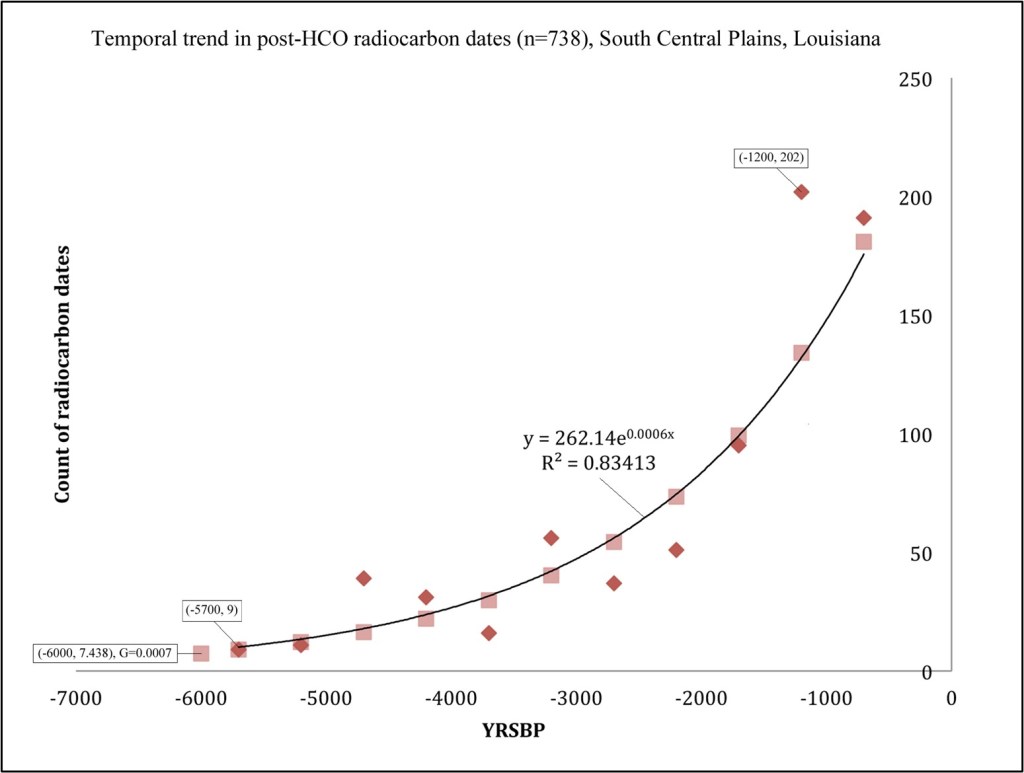
Observations based on the relatively small Ft. Polk area contrast somewhat with the findings from the larger region (South Central Plains) summarized by Alvey (2019), whose summed probability distribution (SPD) plot of 297 radiocarbon dates was interpreted to reflect a demographic decline or geographic shift during the period post-dating ca. AD 1300. A larger clustered set of 738 calibrated assays (Figure 3) complements the demographic trend defined by the sample of Ft. Polk diagnostic projectile points, but for the post-Middle Archaic interval the estimated growth rate is somewhat larger (0.0007, 0.07%). Calculations based on various archaeological proxy measures and ethnographic sources (Table 2) indicate that both approximations of G for the central Louisiana region are probably somewhat inflated (growth functions are extremely sensitive to small differences in rates, particularly over the entire span of New World occupation). A more detailed consideration of the full suite of available radiocarbon dates would more than likely indicate a rate within the fairly narrow range of 0.03–0.05%. The post–6000 BP period considered by Alvey (2019) that includes northwestern Louisiana and southwestern Arkansas is also very closely aligned with the depth of the radiocarbon record at Ft. Polk, where the earliest assay has been obtained on organics from 16VN794 (Beta-49293, 5770 ± 140 BP, cal median 4629 BC; Anderson and Smith 2003: Table 6.2; earlier determinations from the area are based on TL and OCR measures).
Table 2. Various pre-industrial growth rate estimates based on demographic proxy measures and ethnographic data.
| Region | Sample | G | Reference |
| Western Louisiana | diagnostic PP/Ks 14,000-200 BP (6 intervals) | 0.06% | Anderson and Smith 2003 (data) |
| Ozarks | 193 calibrated radiocarbon dates | 0.046 ± 0.0014% | Childress 2021 |
| Global | radiocarbon dates/SPDs; ethnographic sources | 0.043 ± 0.011% | Zahid et al. 2016 |
| Wyoming/Colorado | 7900 calibrated radiocarbon dates | 0.041 ± 0.003% | Zahid et al. 2016 |
| Global range | – | 0.03–0.05% | Bettinger 2016 |
| Southern Interior Low Plateau | 702 calibrated radiocarbon dates | 0.04% | Childress 2021 |
| Interior Low Plateau | 7440 site components across various intervals (harmonic mean of 10 samples) | 0.04% | – |
| Kentucky | 7116 site components across 4 intervals (harmonic mean) | 0.04% | Pollack 2008 (data) |
Finally, with respect to regionally specific population density values, the radiocarbon record is also a valuable proxy measure for consideration, especially allowing for the valid assumption of comparable pre-industrial growth rates (Table 2). Based on date density across the full temporal range of archaeological site components, it is possible to reconstruct density variability between physiographic regions (Table 3). Not surprisingly, the highest density areas appear to have been in the central and lower Mississippi alluvial valley and along the lower reaches of the Tennessee and Cumberland drainages in the southern portion of the Interior Low Plateau (comparable values are probably registered to the north into the Green and Ohio River sections of the Interior Low Plateau, but these data have yet to be fully compiled). Radiocarbon date density suggests populations at roughly 5 to 6 times the density of the flanking uplands, with the Ozark Highlands and northern Missouri hill country at the low end of the range. The South Central Plains of northwestern Louisiana exhibit an intermediate value, but even here the majority of determinations have been obtained from sites within and close to the riparian zone along the Red River (see Alvey 2019:Figure 2.2). The upland interfluvial zones where most of the KNF ranger districts are located would certainly fall into the lowest density category. The broad picture of archaeological site and isolated find density developed from systematic survey on KNF parcels is highly concordant with the larger regional spatial and temporal patterns (for more generalized and comprehensive discussion of the prehistoric demography see Bettinger 1991 and Hassan 1981) .
Table 3. Information on radiocarbon date spatial density by region (Alvey 2019:20; Childress 2021).
| Region | Area (square km) | N dates | Density | STD density |
| Lower LMV Alluvial Plain (LA/MS) | 30080 | 412 | 0.0137 | 12 |
| Southern Interior Low Plateau (TN/MS/AL) | 60600 | 702 | 0.0116 | 10 |
| Upper LMV Alluvial Plain (AR/MO/KY/TN/MS) | 68091 | 537 | 0.0079 | 7 |
| Coastal Zone (LA/MS) | 49239 | 294 | 0.006 | 5 |
| South Central Plains (LA/AR) | 81923 | 297 | 0.0036 | 3 |
| MS/TN Highlands | 129959 | 447 | 0.0034 | 3 |
| AR/MO Ozark Highlands | 69000 | 196 | 0.0028 | 2 |
| AR Ozark Highlands | 64782 | 182 | 0.0028 | 2 |
| Central Dissected Hills (MO) | 61534 | 142 | 0.0023 | 2 |
| MO Ozark Highlands | 94036 | 109 | 0.0012 | 1 |
References Cited
Alvey, J.S. 2019. Paleodemographic Modeling in the Lower Mississippi River Valley. Doctoral dissertation, Department of Anthropology, University of Missouri, Columbia.
Anderson, D.G., and S.D. Smith. 2003. Archaeology, History, and Predictive Modeling: Research at Fort Polk, 1972-2002. University of Alabama Press, Tuscaloosa.
Bettinger, R L. 1991. Hunter–Gatherers: Archaeological and Evolutionary Theory. Plenum Press, New York.
Bettinger, R L. 2016. Prehistoric Hunter–Gatherer Population Growth Rates Rival Those of Agriculturalists. Proceedings of the Natural Academy of Sciences USA 113(4):812-814.
Childress, M.R. 2021. Summary and Discussion. In The SR 13 Flatwoods Bridge Project: Archaeological Testing and Data Recovery at the Elvis Riley Site (40PY288), Skelton Site (40PY289), and Thomason Site (40PY290), Perry County, Tennessee, by G.G. Weaver, J.W. Blazier, and A.R. Lunn, pp. 659-688. Weaver & Associates and Panamerican Consultants, Memphis, Tennessee. Panamerican Report No. 40119. Submitted to the Tennessee Department of Transportation, Nashville.
Childress, M.R., and A. Saatkamp. 2021. Phase I Cultural Resources Survey of 372 Acres on the Kisatchie National Forest, Calcasieu Ranger District, Compartment 28, Rapides Parish, Louisiana. Panamerican Consultants, Memphis. Submitted to Kisatchie National Forest, Pineville, Louisiana.
Hassan, F. 1981. Demographic Archaeology. Academic Press, New York.
Pollack, D. (editor). 2008. The Archaeology of Kentucky: An Update. Kentucky Heritage Council, State Historic Preservation Comprehensive Plan No. 3. Lexington.
Zahid, H.J., E. Robinson, and R.L. Kelly. 2016. Agriculture, Population Growth, and Statistical Analysis of the Radiocarbon Record. Proceedings of the Natural Academy of Sciences USA 113(4):931-935.
